Find Meaning in Your Marketing
Marketing is more effective when you have the right tools to understand your campaigns' performance. VariaMetrix cuts through the noise to focus on what affects your ROI. Our cross-platform drag-and-drop visualization tool gives you immediate actionable insights and reports with just a click. This informative and interactive tool makes your analytics job more meaningful, profitable, and maybe even fun!
Own your own data
VariaMetrix offers first-party tracking that ensures complete ownership of all your collected data. VariaMetrix even exports data it ingests from other tools so you can keep a copy for yourself.
Flexible dashboards
Drag-and-drop interactivity and responsive filters make it easy to build VariaMetrix dashboards in seconds without having to work with clunky APIs. You never have to worry about losing your work because you can access your historical dashboards at any time.
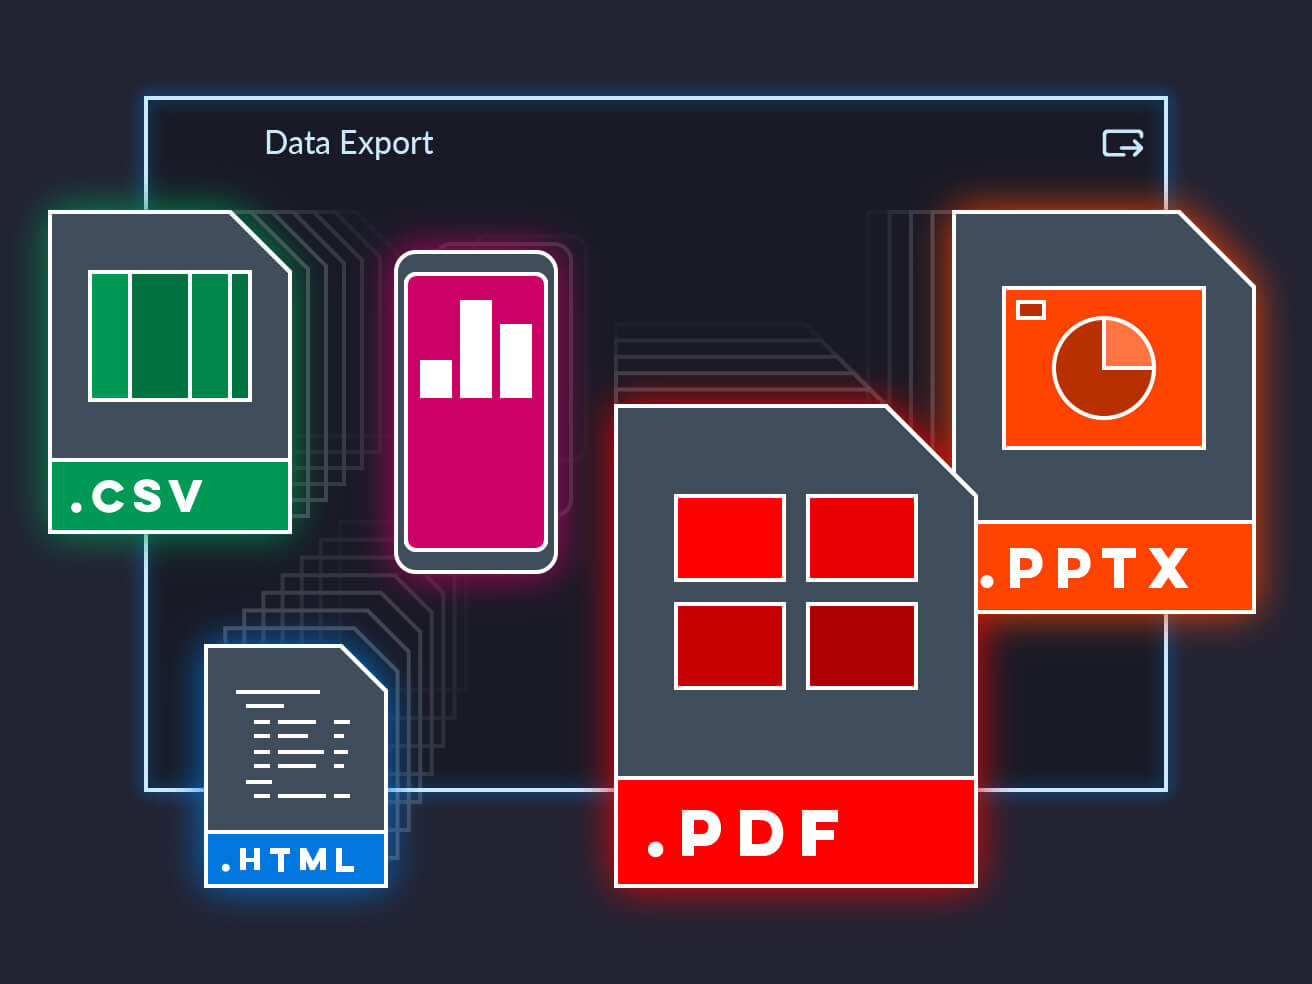
Automated reporting
VariaMetrix exports dashboards to PowerPoint, PDF, spreadsheets, and more. It lets you schedule reports for future processing and delivery so reports are always ready when you are.
Concrete data
Force data to dish out its secrets by making it work for you. Look at the same data in different ways through chart-based date ranges. Understand true seasonality by comparing all historical timeframes.
Charts that actually tell you something
VariaMetrix is focused on making data more readable and usable. Beyond standard reporting, VariaMetrix easily lets you compare to previous and average data so you can see the effect of your campaigns over baselines.
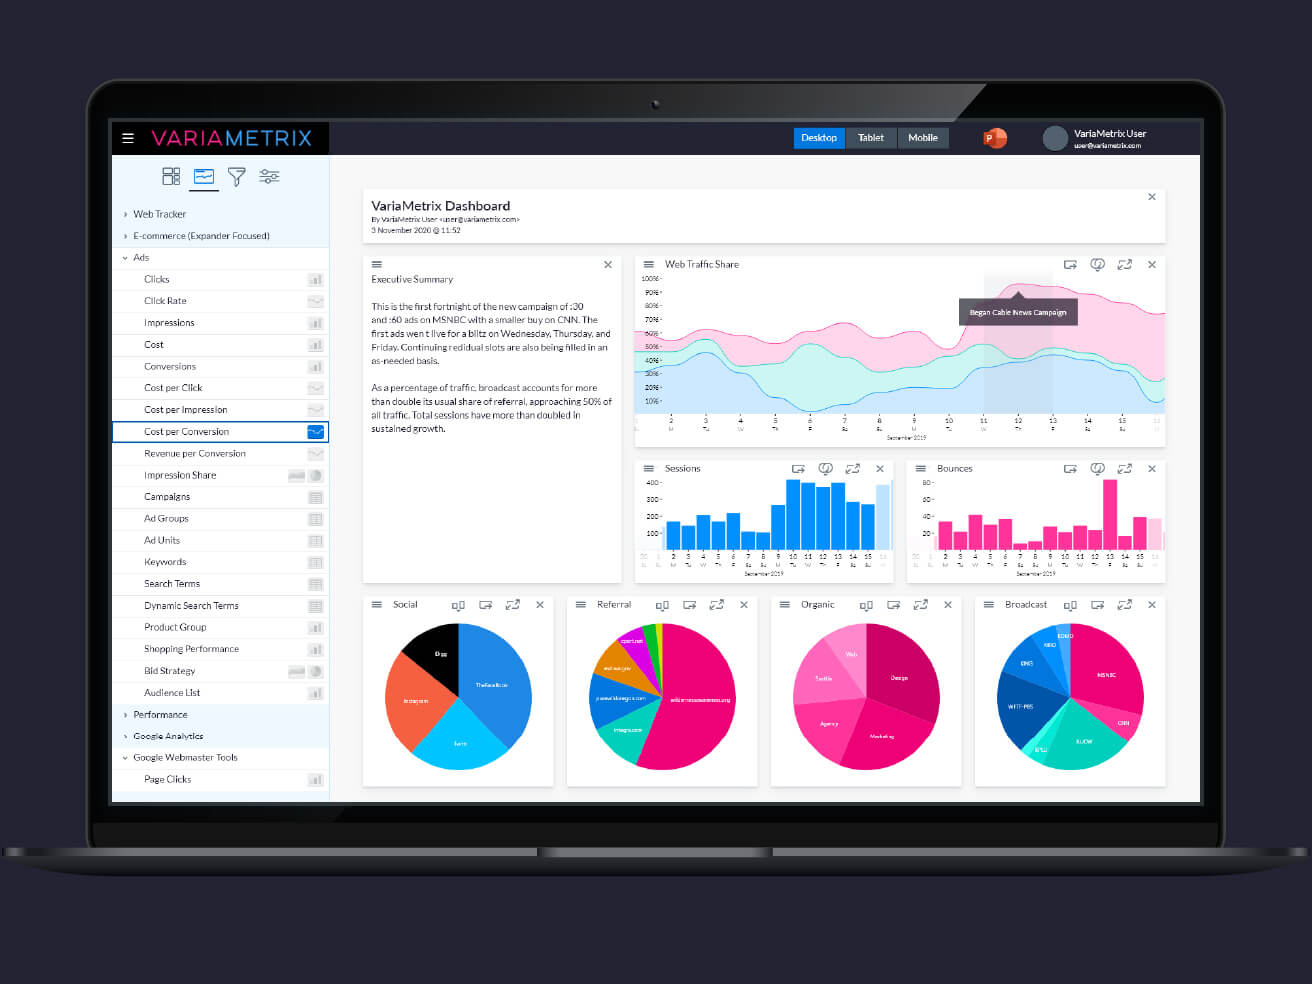
Multiple date ranges
The date view of any report can be made independent of the rest of the reports in a dashboard so you can compare the same report in different ways on one screen.
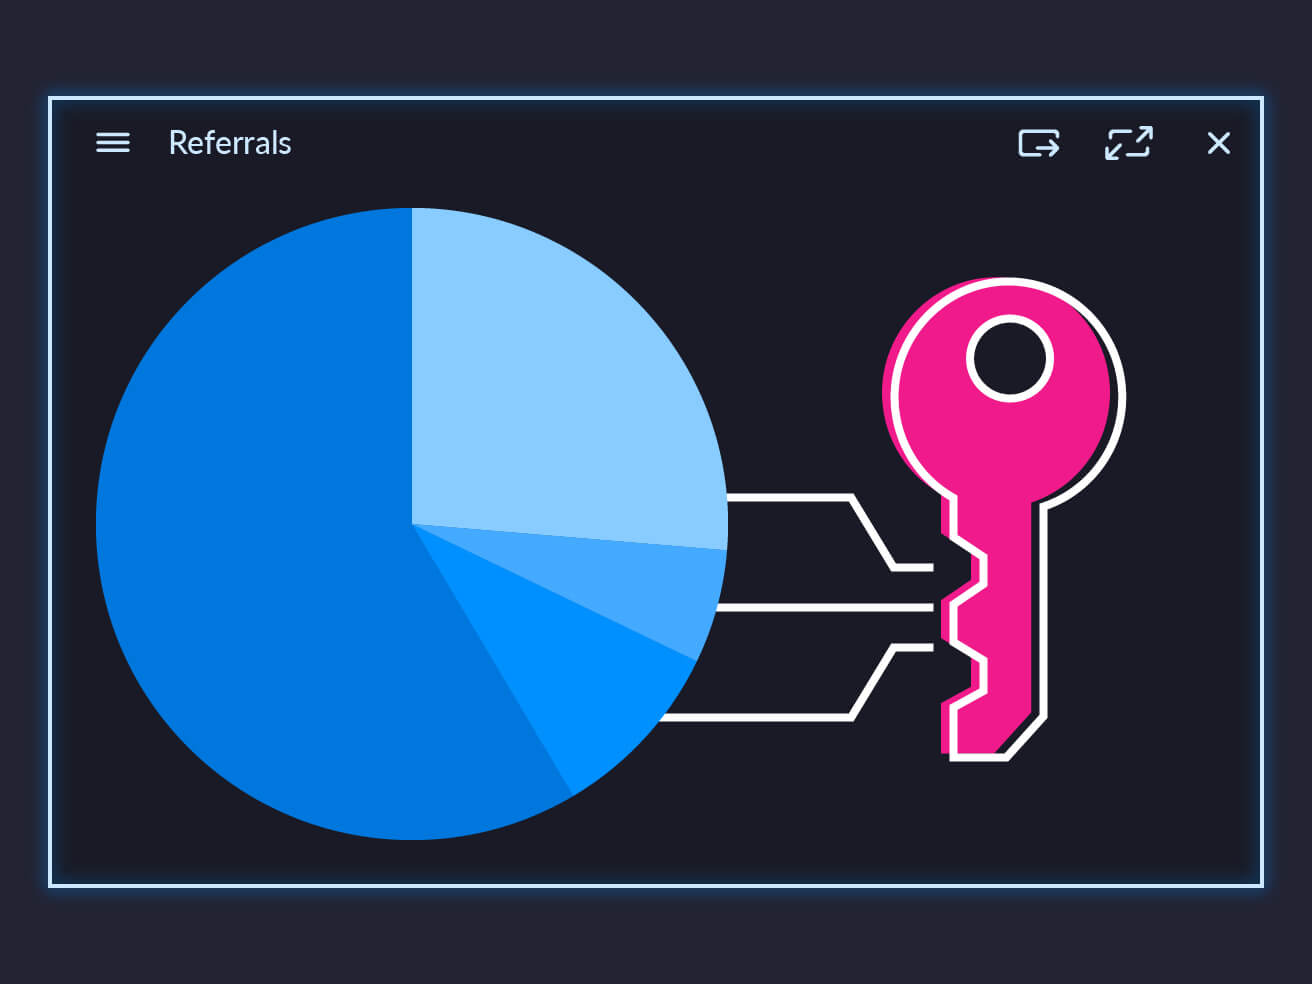
Combined source and attribution
Measure more than just the overall results of your marketing efforts. See where your success is coming from so you can improve on what works and learn what doesn't.
Instant insights
VariaMetrix brings all the elements of marketing together in one place. Connect the dots to learn something new about your campaigns and see performance opportunities that you may have missed just looking over rows and columns.
Microfiltering
Chart blocks show you the big picture first so you can use your expertise to know where to focus. The advanced filtering system gives you the power to dig into any slice of data and loot it for insights.
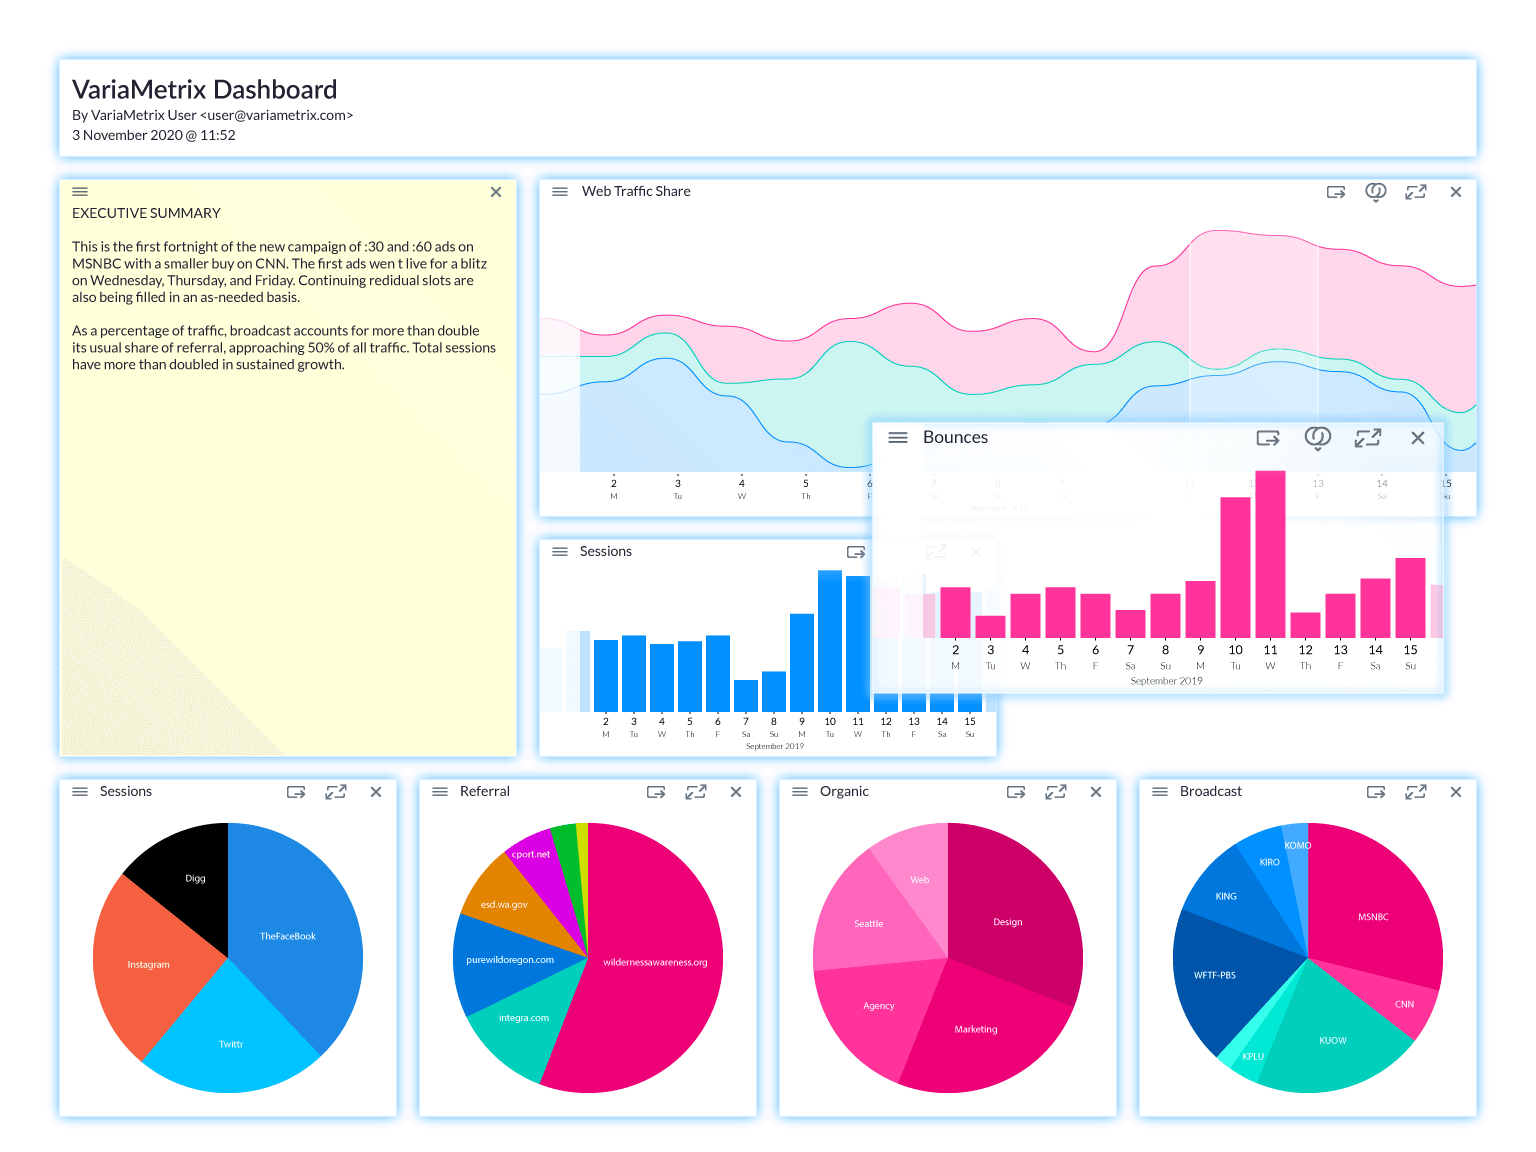
Charts you can merge
VariaMetrix's patented UI makes it easy to compare data by intuitive drag-and-drop. Discover new insights and correlations at a glance, like:
- Do web visits correlate to social media engagements?
- Does organic search traffic impact paid search impressions?
- Does time of day impact message conversion rate?
When you interact seamlessly with data, you will see so much more than what meets the eye.
Contribution highlights
VariaMetrix's contribution reports show you how each channel stacks up when it comes to the conversions that count. These unique reports allow you to see if 80% of your sales are coming from 20% of your cost so you can allocate your budget to maximize your return.
Intuitive interface
VariaMetrix is a tool created for marketers by marketers, but not everyone has a background in data science. It’s designed from the beginning to be intuitive and engaging for any level of user.
Built for the many-hats
Whatever your marketing role, VariaMetrix makes it easier. From automated dashboards to channel attribution, VariaMetrix lets you see beyond the data and get you to the insights you need.
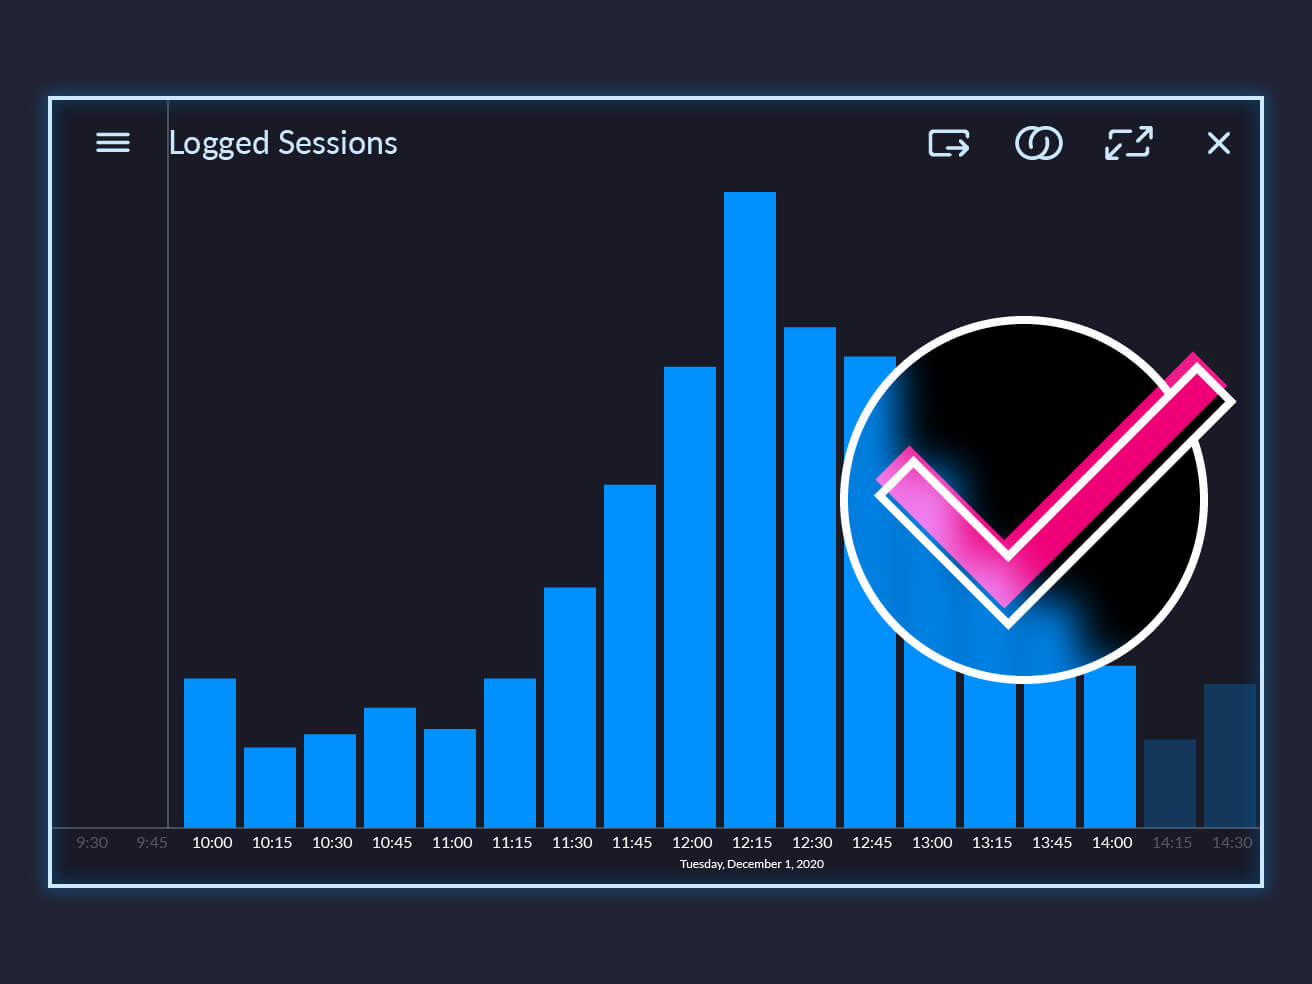
Annotate data, not charts
Data spikes happen, but that doesn't mean the whole team needs to investigate and lose a whole day of productivity. With VariaMetrix, one person can research and annotate the patterns they find and communicate those findings to everyone right within the charts. Insights are connected to the data itself, so when another user views a chart with the annotated data, they'll also see the annotation.
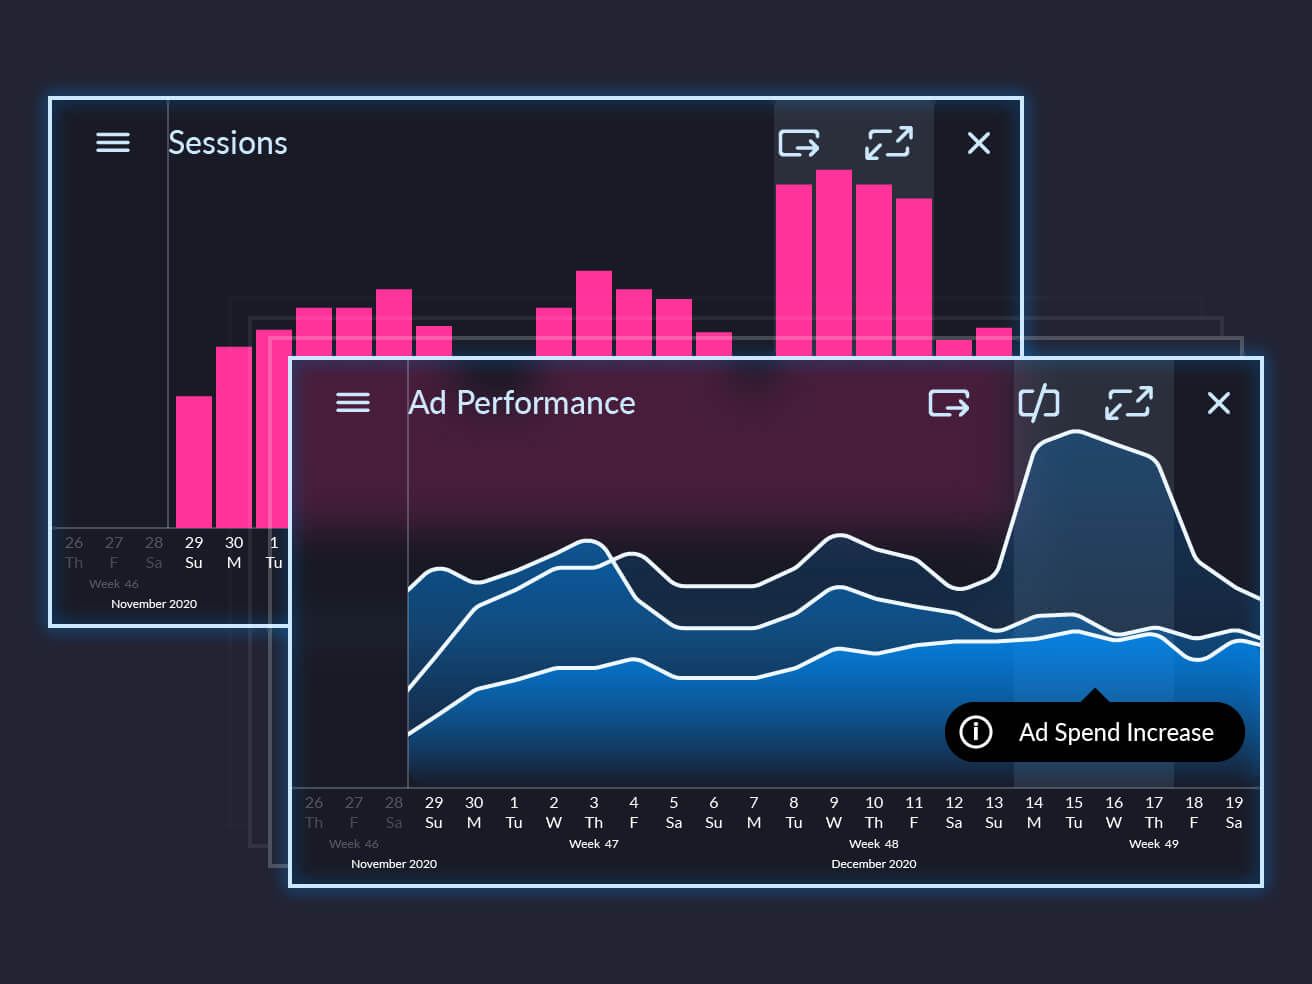
Atomicity on demand
VariaMetrix is the only tool that lets you set filters chart-by-chart or across the entire dashboard. If you want to see the same data over multiple timeframes on one screen, go ahead! Or lock a combination of charts to your global timescale and update them all at once. VariaMetrix puts you in total control of how your information is displayed.
Polished reports
VariaMetrix makes reporting truly automated. Build your dashboard to show exactly the level of detail you want to know or show, and export with just a click.
Merge-able data
Most dashboard solutions will show you vendor charts side-by-side to save you from logging in to everything. Since VariaMetrix imports your data we can combine from everywhere and aggregate data. View all of your paid clicks or impressions compared to all email traffic from various platforms. And with our total data ownership policy the data is always yours and will never be used outside of your account.
Instant presentation
Present to clients, executives, or other stakeholders with ease. VariaMetrix exports any dashboard directly to PowerPoint with publication-quality charts using live data instead of images, making it easy to perform edits or apply your own company's PowerPoint theme.
Built for teams
VariaMetrix dashboards can be personalized for individual use or built for the entire team.
Total data ownership
VariaMetrix helps you to own all your data, including third-party info.
Data accessibility
Our core modules always keep data under your control, even if your data source goes kaput.
Unified datasets
Because you control how data is collected with VariaMetrix, there is no limit to the range of custom data and detailed information that can be collected. Our managed services partner's implementation services help you integrate VariaMetrix in your web site or app.
Fine-grained access
VariaMetrix reports data in exact, concrete terms and doesn't fuzz or obfuscate the data like “free” tools. We give you the actual information.
Anytime export
With VariaMetrix, data is always available for export in whatever format you need . You can request all data to be turned over to you instead of living on third-party servers.